

Businesses around the world generate massive quantities of data daily in the form of server logs, web analytics, transactional information, and customer data. To effectively process this much information and derive actual value from it, businesses need to consider advanced analytics techniques for decision-making. We already discussed its applications across industries in our previous article. But what does that journey, or the advanced data analytics lifecycle look like?
What is the advanced data analytics lifecycle?
Data goes through several phases such as creation, testing, consumption, and processing during its tenure in an analytics project. The advanced analytics lifecycle enables professionals working with the data to map out a high-level overview of all the distinct phases involved in the process of gathering and processing information.
Advanced data analytics lifecycle phases
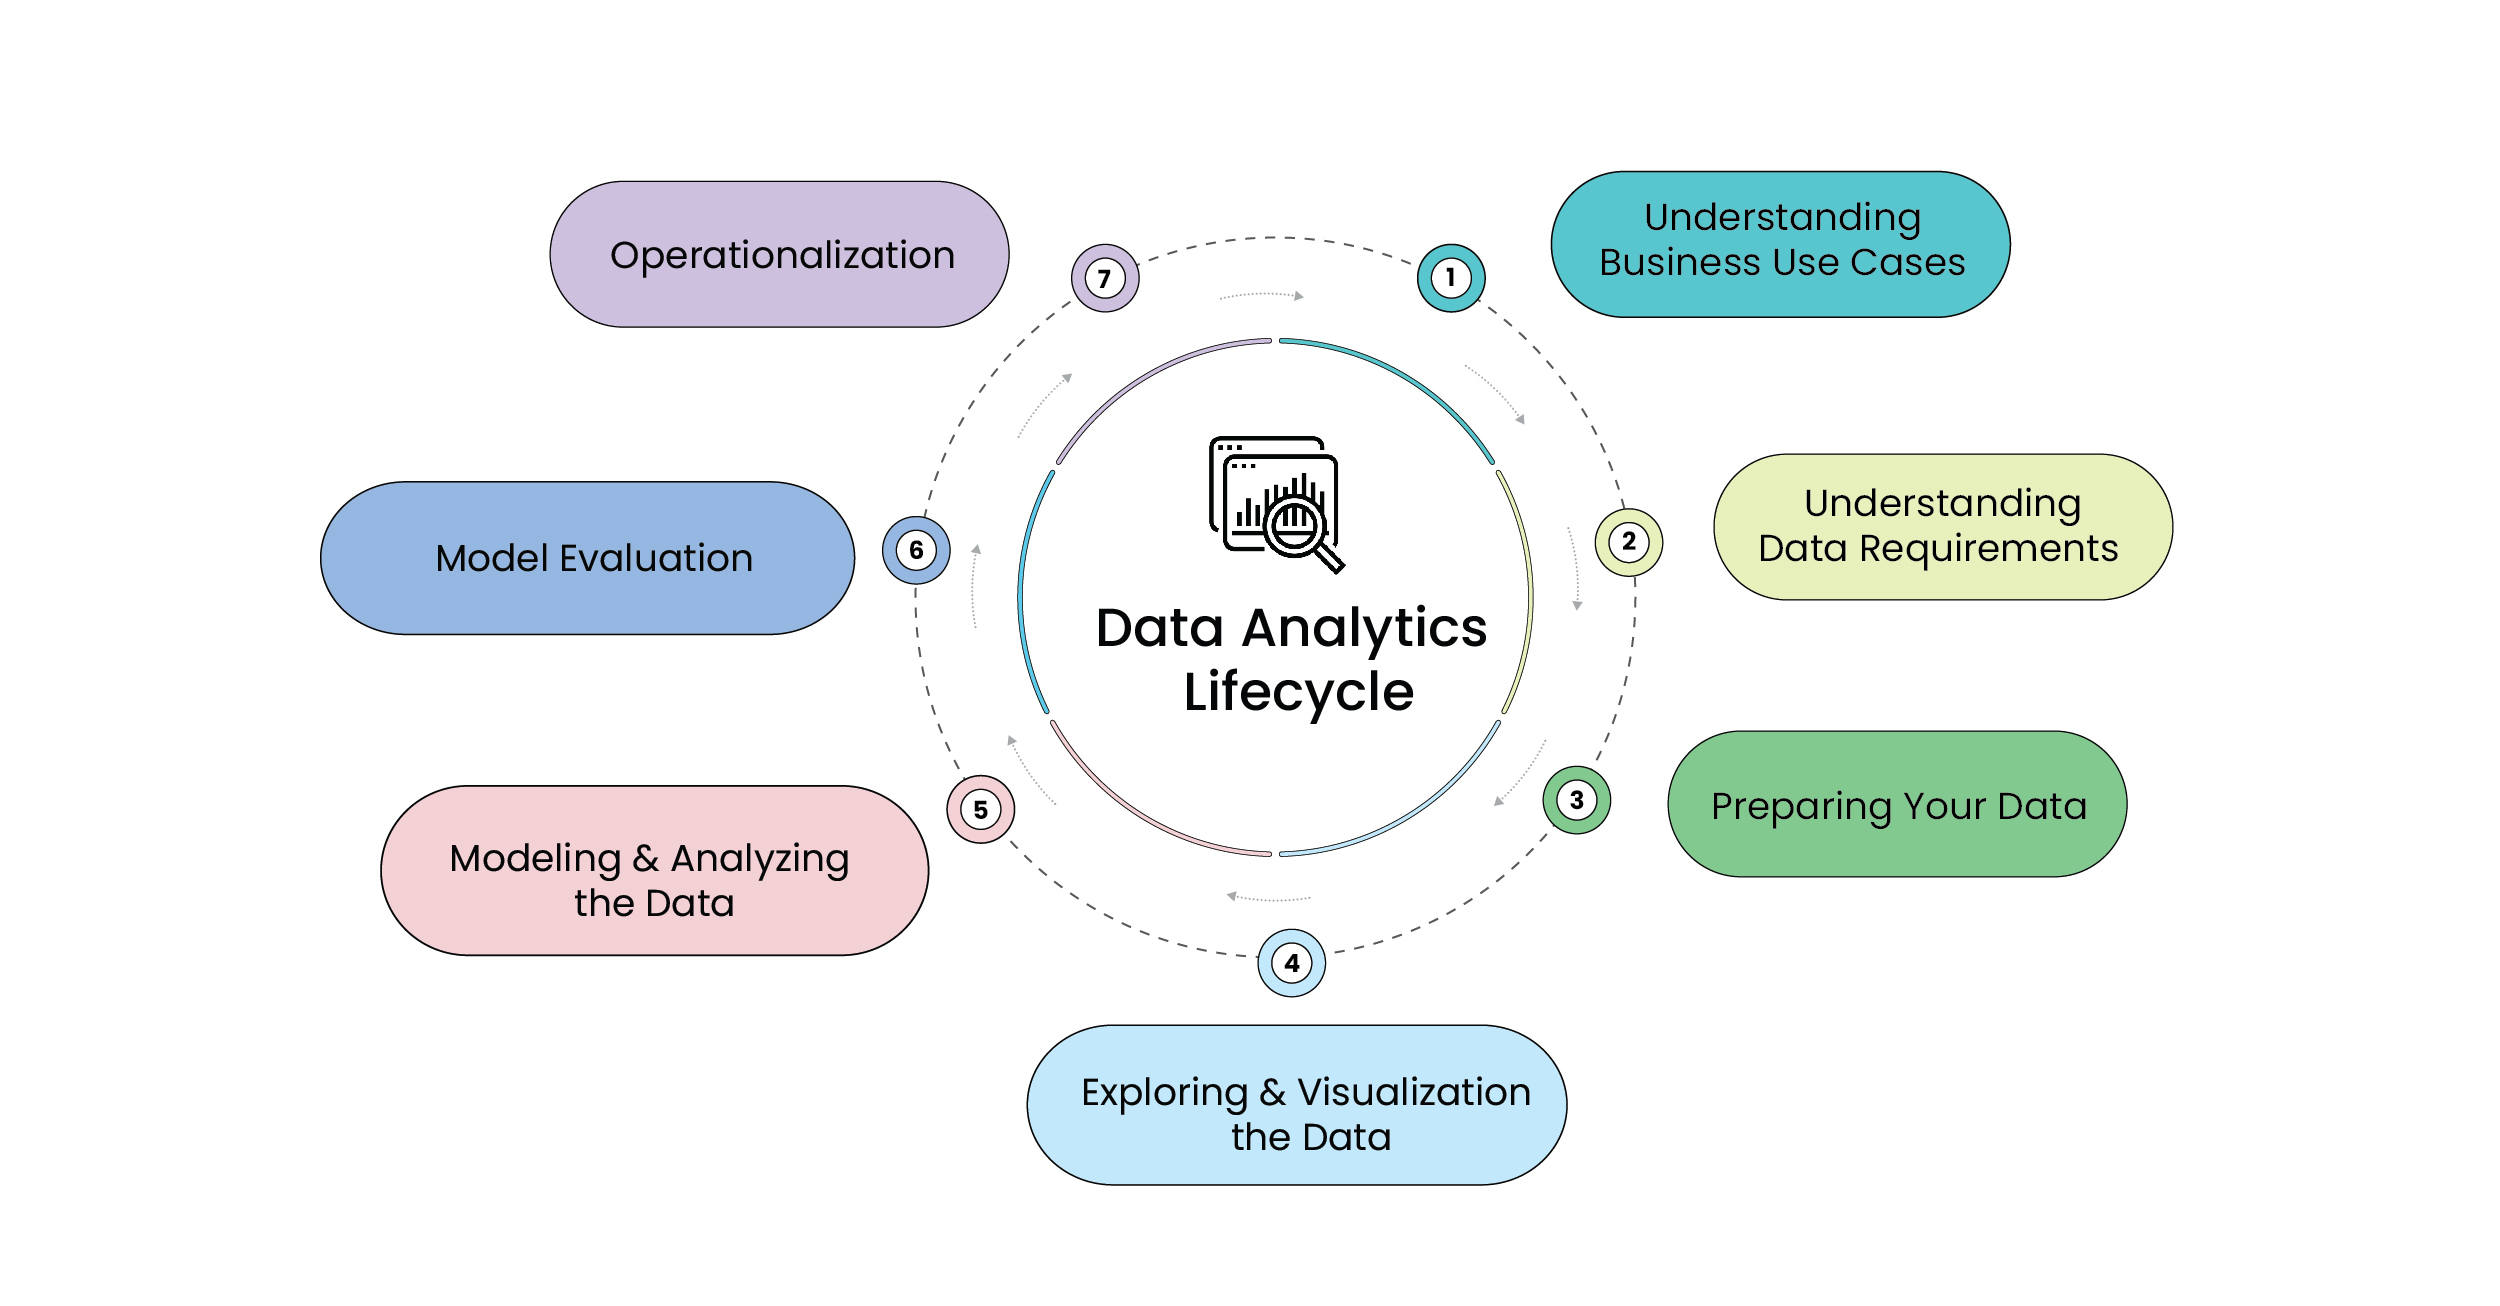
The different advanced analytics lifecycle phases
As the illustration shows, the analytics lifecycle phases are iterative and cyclical. Data professionals can use the circular nature of the lifecycle to approach data analytics in a forward or backward direction. Based on what they learnt in the preceding phase, they can choose to continue with existing research or scrap it entirely and redo the analysis.
Let us take a more detailed look at each of these phases.
1. Understanding business use cases
This phase deals with identifying specific business applications of the data that is collected. The more clearly a business can frame the problem they are trying to address with data analytics, the greater the chance that the AI/ML model developed at the end of the lifecycle succeeds.
While the iterative nature of data analytics makes it an inherently time-consuming process, modern ML tools have evolved to a point where they can speed things up significantly. For example, with an intelligence platform such as Enrich, you have access to a wide array of pre-built, organization-specific use case apps such as
- Anomaly Detection (Identifying fraudulent behavior, anti-money laundering (AML), risk management, cybersecurity)
- Scenario Planning (risk management, sales scenarios)
- Performance benchmarking (partner performance, employee performance)
As a result, your time-to-value for business decision making can be significantly accelerated. With use cases for every business domain, platforms like Enrich allow companies to solve persistent business problems with speed and accuracy, without the usual complexity of MLOps.
2. Understanding data requirements
Once the business use case has been identified and the data analytics problem has been defined, the next step is to gather the data that is relevant to the problem. This may involve accessing existing data sources, such as databases or files, or acquiring new data through surveys or experiments.
When gathering data for data analytics, it is important to consider the following factors:
- Types of data: What kind of data needs to be collected, and why? (Financial projections, sales figures, employee health information, website analytics etc.)
- The data sources: What data is available, and where does it come from? This may include internal data sources, such as databases or transactional systems, as well as external data sources, such as public datasets or third-party APIs.
- The data quality: Is the data accurate, complete, and relevant to the analysis? What are the potential sources of errors, biases, or inconsistencies in the data?
- The data privacy and ethics: Are there any legal, ethical, or privacy considerations that need to be taken into account when collecting or using the data?
- Resource availability: Time, expertise, technology, workforce, data
- Clarity of problem definition: How can the problem be framed most accurately to give your data models a reasonable chance to succeed?
3. Preparing your data
This phase involves the collection, cleaning, and processing of data to make it usable for the model building process. Data must be intricately sifted through to identify essential items. Complex validation rules may need to be put into place to identify and eliminate invalid data. For example, you may have rows with null entries in your input dataset. Creating a series of validation rules allows you to drop rows with null entries, improving the quality of your data, also making the resultant output easier to understand.
There is a period of information gathering using data collection methods such as
- Data Entry: Collecting data from digital systems or via manual entry
- Signal Reception: Data can also be collected from digital sources such as IoT devices and control systems
- Data Acquisition: Aggregating data from external sources
This phase also requires an analytics sandbox that can be used by the team to work with data and test different hypotheses for the duration of the analytics lifecycle. The analytics sandbox allows the efficient processing of a wide range of data and creates an environment that allows data analysts to process and schedule data assets using their preferred tools.
Data can be loaded into the sandbox in a variety of ways
- ELT (Extract, Load, Transform): Data is loaded into the sandbox and then transformed based on the business rules.
- ETL (Extract, Transform, Load): Data is transformed based on business rules before it is loaded into the sandbox
- ETLT (Extract, Transform, Load, Transform): This is the combination of ELT and ETL and has two separate transformation levels
At this stage, the analytics team will perform several different operations on the data to make it usable for the next phase, such as
- Cleaning and sanitizing data (misspellings, missing data, illogical entries, duplicates)
- Characterizing data (visually and statistically)
- Identifying useful variables/parameters
- Generating richer parameters
4. Exploring and visualizing the data
Once the data has been cleaned and prepared, the next step in the data analytics process is to explore and visualize the data. This involves looking at the data in different ways to get a better understanding of its contents and characteristics.
Exploring and visualizing data can help in several ways:
- Identifying patterns, trends, and relationships: By looking at the data in different ways, such as through graphs, charts, or maps, you can identify patterns, trends, and relationships that may not be apparent from raw data.
- Generating hypotheses and questions: Exploring and visualizing the data can generate new ideas and hypotheses about the data, and can help you form new research questions or hypotheses to test.
- Communicating the data: Visualizations can be an effective way to communicate the data and its insights to others, such as stakeholders or colleagues.
- Debugging and checking assumptions: Exploring and visualizing the data can help you detect errors or inconsistencies in the data, and can help you check the assumptions and limitations of your analysis methods.
There are several different exploratory data analysis (EDA) methodologies that can be used, depending on the type of data being analyzed or the problem being addressed. Some common EDA methodologies include:
- Univariate analysis: This involves analyzing the data one variable at a time, using techniques such as frequency tables, histograms, and box plots.
- Bivariate analysis: This involves analyzing the relationships between two variables, using techniques such as scatter plots and correlation analysis.
- Multivariate analysis: This involves analyzing the relationships among multiple variables, using techniques such as principal component analysis and cluster analysis.
- Time series analysis: This involves analyzing data over time, using techniques such as autocorrelation analysis and exponential smoothing.
Some common visualization methods include:
- Bar charts, which show data as horizontal or vertical bars, and are useful for comparing the sizes of different categories.
- Line graphs, which show data as a series of connected points, and are useful for tracking changes over time.
- Scatter plots, which show the relationship between two numeric variables, and can be used to identify patterns and correlations.
- Histograms, which show the distribution of a numeric variable, and can be used to identify trends and anomalies.
- Box plots, which show the distribution of a numeric variable, and can be used to compare the spread of different groups.
- Heat maps, which show the relationship between two categorical variables, and can be used to identify trends and outliers.
- Treemaps, which show hierarchical data as nested rectangles, and can be used to compare the proportions of different groups.
- Word clouds, which show the relative frequencies of words in a text, and can be used to quickly identify common themes.
- Choropleth maps, which show data as variations in color or shading within geographic regions, and can be used to show patterns and trends on a map.
- Network diagrams, which show connections and relationships between entities, and can be used to identify clusters and communities.
By exploring and visualizing the data, organizations can gain a better understanding of their data and can generate new insights and ideas. This can help them make better decisions and drive innovation.
5. Modeling and analyzing the data
In data modeling, a statistical or machine learning model is developed to represent the relationships and patterns in a dataset. This model can then be used to make predictions or generate insights from the data.
It includes identifying suitable methodologies to be used, accounting for the real-world scenarios, iteratively training, and tailoring for the application or use case at hand. It is important to test the model for performance and accuracy to understand if the results make sense and verify that the model is performing as intended.
Developing a statistical model involves choosing an appropriate model and fitting it to the data. This typically involves selecting a model that is appropriate for the specific problem or research question, and that can capture the underlying patterns and relationships in the data.
There are many different statistical modeling methods that can be used for different purposes. Some common statistical modeling methods include:
- Regression, which is used to predict a continuous outcome variable based on one or more predictor variables.
- Classification, which is used to predict a categorical outcome variable based on one or more predictor variables.
- Clustering, which is used to group similar data points together.
- Dimensionality reduction, which is used to reduce the number of variables in a dataset while retaining as much information as possible.
- Time series analysis, which is used to analyze data that is collected over time.
- Survival analysis, which is used to analyze data that is collected over time and study the factors that affect how long it takes for a particular event to occur.
These are just a few examples of statistical modeling methods, and there are many others that can be used depending on the specific problem being addressed.
6. Model evaluation
Evaluating a model helps to ensure that the model is accurate and effective. Without evaluation, it is difficult to know whether the model is making accurate predictions, or whether it is just overfitting to the training data.
Model validation is closely coupled with model development. Once a model offers a certain degree of confidence in the development stage, all model components (such as the input, processing, output) undergo rigorous validation. This includes testing for all possible scenarios and corner cases. Thorough validation ensures a sound (unbiased and accurate), and robust model. It also helps identify potential limitations of the model and assess its possible impact.
The model development and validation also involves collating the results and checking the sanity of the outcomes with the business stakeholders and domain experts.
For the model outputs to seamlessly integrate with the business requirements and processes, it is important to ensure that the output is presented in a format understandable by the end user.
To evaluate a data analytics model, you would typically use a combination of quantitative and qualitative methods. Some common methods include:
- Accuracy: This is the most common metric for evaluating a predictive model, and it measures the percentage of predictions that are correct.
- Precision and recall: These metrics are often used together to evaluate a classification model, and they measure the percentage of true positives and true negatives in the predictions.
- F1 score: This is the harmonic mean of precision and recall, and it provides a single score that balances both metrics.
- AUC-ROC: This stands for “area under the receiver operating characteristic curve,” and it is a metric that evaluates the ability of a model to distinguish between positive and negative classes.
- Root mean squared error (RMSE): This is a measure of the difference between predicted and actual values, and it is commonly used for regression models.
- Mean absolute error (MAE): This is similar to RMSE, but it is the average of the absolute differences between predicted and actual values, rather than the square root of the average squared differences.
- Confusion matrix: This is a table that shows the number of true positives, true negatives, false positives, and false negatives in a classification model, and it is useful for understanding the types of errors the model is making.
- Lift chart: This is a graphical representation of the performance of a predictive model, and it shows the difference between the model’s predictions and a baseline such as random guessing.
- Feature importance: A feature is a measurable property of the object being analyzed, appearing as columns in datasets. Feature importance is a measure of the relative importance of each feature in a model, and it can help to identify which features are most important for making accurate predictions.
- Qualitative evaluation: In addition to quantitative metrics, it can also be useful to evaluate a model qualitatively, by examining a sample of the predictions and checking whether they make sense in the context of the problem.
7. Operationalization
After the initial phase of model development, and after an approval from all the stakeholders on the robustness and veracity of the outcomes, the model is moved to production or operationalized. From here on, it enters a continuous cycle of monitoring, performance assessment, and refinement.
To gauge the effectiveness of your analysis, the model must be moved into a live environment and monitored closely. If the findings conform to your expectations and business objectives, the reports and results can be finalized. On the other hand, if the findings deviate from the expected outcome, the team moves back to the previous phase in the lifecycle to change the inputs and get a different output.
We hope reading this helps you understand the cyclical, iterative advanced data analytics lifecycle. It is a valuable framework that helps data analysts conceptualize and organize mammoth data analytics projects.
To learn more about our organization-specific prebuilt app store and the transformative potential of data-driven decision making, schedule a personalized consultation session with one of our product experts.
Do check out Carver Agents’ RegWatch – our new AI solution for real-time contextual regulatory risk intelligence, built for risk and strategy executives. Think of it as agentized mid-market LexisNexis. Visit https://carveragents.ai/.