In today’s data-driven business landscape, organizations are constantly pressured to make faster, more informed decisions that drive better outcomes. According to Forbes, 53% of companies use big data analytics to take inform business decisions.
An HBR study points out that companies that use data-driven decision-making are 6% more profitable than those that don’t. However, with the exponential growth of data, it can take time to extract relevant insights that can be used to inform strategic decision-making.
This is where advanced analytics can help. By leveraging sophisticated data analysis techniques and tools, organizations can unlock the full potential of their data and gain a competitive advantage in the marketplace.
Advanced analytics techniques such as machine learning, natural language processing, and predictive analytics provide a powerful tool for analyzing structured and unstructured data sources, which can draw meaningful conclusions about customer behavior, market trends, resource utilization, and more.
By leveraging AI-driven analytics tools such as artificial neural networks (ANNs), businesses can detect subtle correlations between variables that were not previously possible. In addition, advanced analytics techniques allow companies to spot trends faster than ever by looking at large datasets in real-time and reacting accordingly.
This blog will show how advanced analytics techniques can duel data-driven decision-making for your organization.
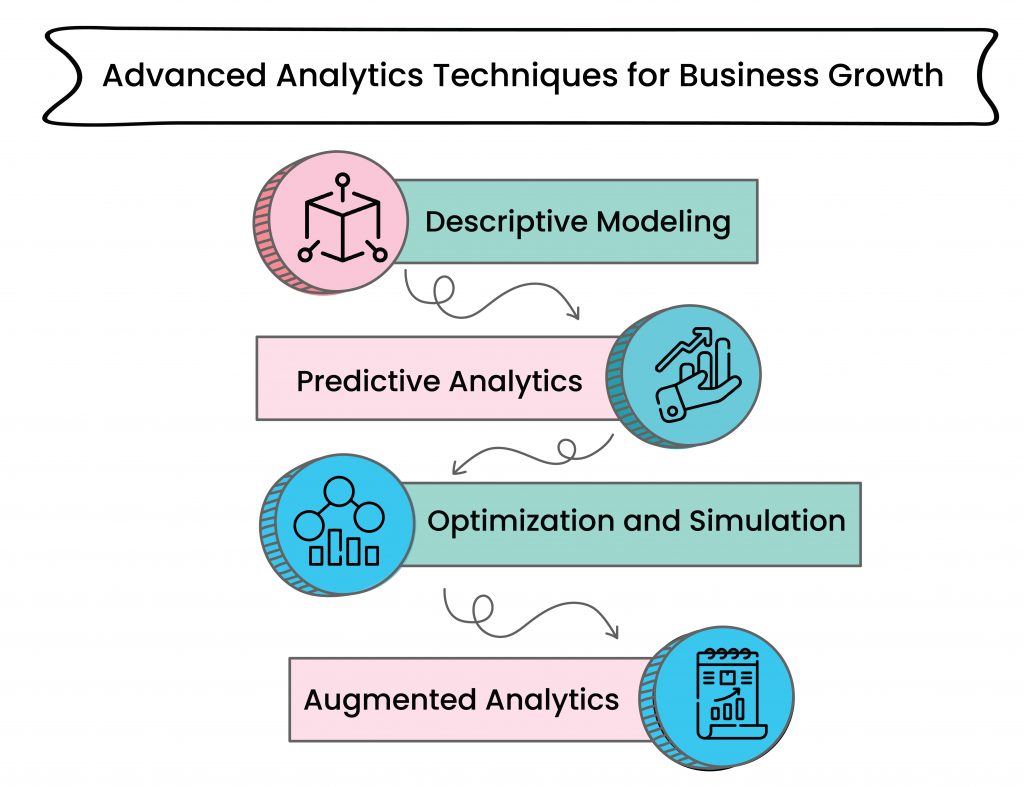
4 Advanced Analytics Techniques to Enhance Your Business
As businesses collect more and more data, it’s becoming increasingly important to have the right tools and techniques to make sense of that data and use it to make informed decisions.
Advanced analytics techniques can give businesses powerful tools for analyzing and interpreting data, allowing them to uncover insights, identify trends, and make predictions.

We will look at four advanced analytics techniques providing an overview of each method and real-life examples of companies that have successfully implemented them
1. Descriptive Modeling
Descriptive modeling is an analytics technique used to understand data better. It focuses on describing the characteristics of the data, such as patterns and relationships, rather than attempting to predict future outcomes.
Here are a few areas where descriptive modeling can be used:
1. Sales Analysis: Companies use descriptive analytics to analyze sales data and identify trends and patterns in customer behavior. For example, a retailer might analyze sales data to determine which products sell the most and which demographics buy them.
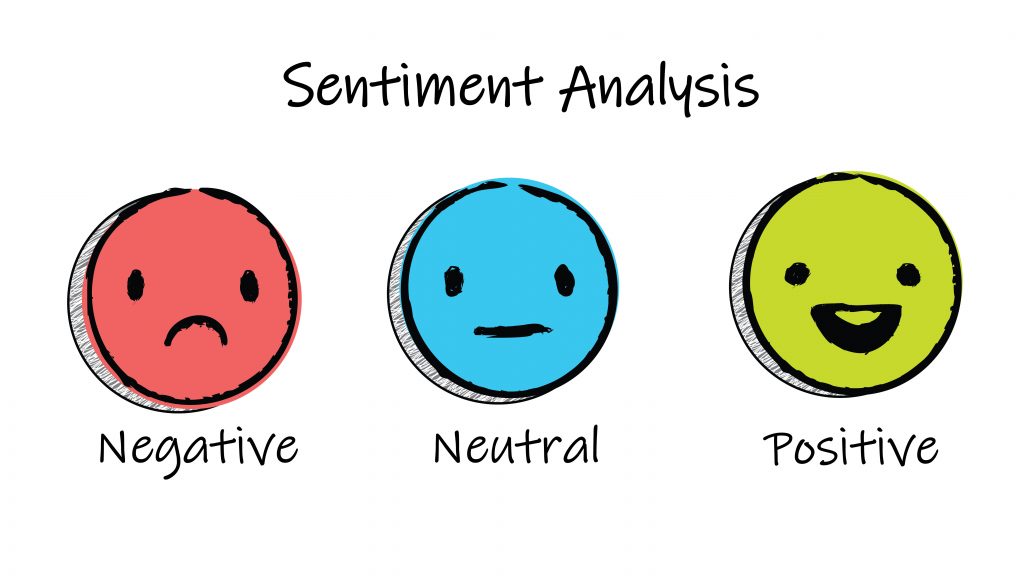
2. Social Media Analysis: Brands can analyze social media data and identify trends and patterns in customer sentiment. For instance, social media analysis tracks the mention of its brand and identifies areas where it can improve its customer service.

3. Financial Analysis: Banks and other financial institutions use descriptive analytics to analyze financial data and identify trends in customer behavior. For example, a bank might analyze credit card transactions to identify patterns in customer spending and inform targeted marketing campaigns.
4. Supply Chain Analysis: Logistics companies can use descriptive modeling to analyze supply chain data and identify areas to optimize their operations. For instance, a shipping company might analyze delivery times and identify bottlenecks in its supply chain to improve efficiency.
Not just these sectors, hospitals and clinics can also use descriptive analytics to model patient outcomes. Cleveland Clinic is one such which uses descriptive modeling to predict patient outcomes. It helps healthcare providers identify patients at high risk for readmission or complications after surgery, allowing them to take preventive measures and improve patient outcomes.
The study found that using predictive modeling reduced readmissions by up to 50% and saved an estimated $8 million in healthcare costs.
A report by McKinsey & Company emphasized how descriptive modeling can help financial institutions improve their credit risk models and make more informed lending decisions. It found that banks that use predictive modeling for credit risk assessment can achieve a 20% reduction in loan defaults and a 10% increase in profits.
2. Predictive Analytics
Predictive analytics uses data, statistical algorithms, and machine learning techniques to identify the likelihood of future outcomes based on historical data. In other words, predictive analytics can help businesses predict what will likely happen in the future based on patterns and trends in their data.
Companies can use these insights to develop strategies, create more accurate forecasts, and gain a competitive edge over other businesses in their industry.
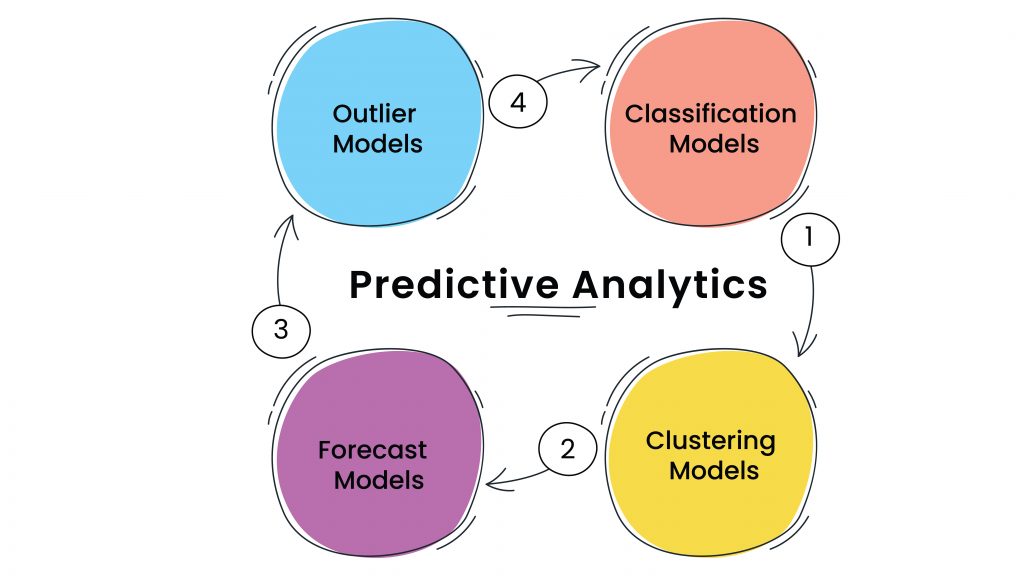
Predictive analytics’ accuracy is only as good as the data and models that is used to generate the predictions. Here are the most commonly used models in predictive analytics:

1. Classification Models: A classification model is a predictive model that uses historical data to categorize new data into one or more classes or categories.
| Classification Model example:
Companies such as FICO, Experian, and TransUnion use classification models to predict creditworthiness and assign credit scores to individuals based on their credit history, income, and outstanding debts. |
(or)
For example, companies such as FICO, Experian, and TransUnion use classification models to predict creditworthiness and assign credit scores to individuals based on their credit history, income, and outstanding debts.
Lenders then use this information to decide whether to approve or deny loan applications.
The goal is to identify patterns in the data that can be used to predict future events or outcomes. These models are used in credit scoring, fraud detection, and medical diagnosis.
2. Clustering Models: The clustering model groups similar data points together based on their characteristics or attributes.
| Clustering Model example:
Target and Walmart use clustering models to segment customers based on their buying behavior and preferences. By analyzing data on past purchases and identifying patterns in customer behavior, they can group customers into different segments and target them with tailored marketing messages and offers. |
The aim is to identify patterns in the data that can be used to predict future events or outcomes. It is commonly used in customer segmentation and healthcare.
3. Forecast Models: A forecast model uses historical data to predict future events or outcomes.
| Forecast Model example:
Procter & Gamble uses forecast model to predict product demand and optimize supply chain operations. The company makes accurate predictions about future demand and adjusts its production and inventory accordingly. |
It identifies patterns in data that can be used to make accurate predictions about future trends or events. It finds its usage in supply chain management and energy demand prediction.
4. Outlier Models: An outlier model identifies data points outside normal patterns or trends.
| Outlier Model example:
Credit card companies use outliers models to detect and prevent fraud. American Express uses an outlier model to identify transactions outside of normal patterns. This has helped them achieve 50% less fraud and identity threats earlier. |
This model finds anomalies in the data that can be used to predict future events or outcomes. Financial institutions commonly use it for credit card fraud detection and quality control.
5. Time-Series Models: A time series is used to make predictions about future events or outcomes over a period of time.
| Time-Series model example:
Meteorologists use time-series models to predict weather patterns and provide accurate weather forecasts. By analyzing historical weather data and identifying patterns in weather patterns, meteorologists can make accurate predictions about future weather conditions. |
It finds patterns in the data that can be used to make accurate predictions about future trends or events. It finds its application in financial markets and weather forecasting.
Descriptive modeling is a powerful technique for gaining valuable insights and making informed decisions by analyzing historical data and identifying trends and patterns. By leveraging this, organizations can identify new opportunities, optimize business processes, and gain a competitive edge in their respective markets.
3. Optimization and Simulation
Optimization and simulation use mathematical and statistical models to develop complicated systems and processes.
Advanced analytics frequently uses optimization to streamline operations, cut costs, and boost productivity. Resource allocation, production schedule planning, supply chain optimization, and inventory level management can all be done using optimization models.
On the other hand, simulation entails developing a virtual representation of a system or process and then conducting experiments to ascertain how it responds to various circumstances. Businesses can understand complicated systems and processes and find areas for improvement using simulation.
Combining them enables the modeling and optimization of intricate systems like supply chains, grids of electricity, and transportation networks.
For example, companies can use simulation models to predict demand for their products and optimization models to determine the most cost-effective way to meet that demand.
The multinational energy company, Shell, uses optimization and simulation models. Shell uses advanced analytics to
- Model and optimize supply chain operations
- Manage the flow of materials and products
- Pass information from suppliers to customers
- Reduce wastage
- Optimize gas production processes
- Predict the behavior of oil reservoirs to increase production
- Get information on the cost-effective routes for transporting products
This information helped Shell to save millions of dollars each year and improve their overall supply chain performance.
Similarly, businesses can use simulation models to predict the impact of different policies or scenarios on their operations and optimization models to find the best course of action.
Optimization and simulation are powerful tools in the advanced analytics toolkit, allowing businesses to make more informed decisions, reduce costs, and increase efficiency.
4. Augmented Analytics
Augmented analytics is an approach to advanced analytics that uses machine learning and natural language processing techniques to automate and enhance data analysis. Augmented analytics aims to make it easier for business users to access and analyze complex data without requiring advanced technical skills.
With augmented analytics, users can ask questions in plain language, and the system will automatically generate insights and visualizations based on the data.
This approach allows users to quickly and easily identify trends, patterns, and anomalies without manually sifting through large amounts of data or writing complex queries.
One of the key benefits of augmented analytics is that it can help businesses to uncover insights and opportunities that may have been missed with traditional data analysis techniques.
For example, augmented analytics can identify customer behavior patterns that may indicate a need for new products or services or detect fraud in financial transactions. Another benefit of augmented analytics is that it can help businesses to improve the accuracy and reliability of their data analysis.
Samsung’s global electronics manufacturer uses augmented analytics to improve product development. Samsung’s product development involves analyzing
- Large amounts of data on customer preferences,
- Market trends,
- Product performance,
- New product opportunities, and
- Improve existing products
Using augmented analytics, Samsung automates data analysis and generates faster and more accurate insights.
It also uses natural language processing techniques to analyze customer reviews and feedback on its products, allowing them to identify areas for improvement and new product opportunities quickly.
By analyzing supplier performance, production processes, and inventory levels, Samsung identifies opportunities to reduce costs and improve efficiency.
Overall, augmented analytics is essential for Samsung’s product development and supply chain operations. It allows them to quickly and accurately analyze large amounts of complex data and make informed decisions based on reliable insights.
By using machine learning algorithms to automate the analysis process, businesses can reduce the risk of human error and ensure that their analysis is based on objective, data-driven insights.
Augmented analytics is an innovative approach to advanced analytics that can help businesses to improve their decision-making and gain a competitive edge.
Businesses can unlock new insights and opportunities and make more informed decisions based on reliable, data-driven insights by automating and enhancing data analysis.
Conclusion
Businesses can gain valuable insights into their operations, customers, and markets by leveraging descriptive modeling, predictive analytics, optimization and simulation, and augmented analytics.
Advanced analytics allows businesses to move beyond traditional reporting and analysis and into a more sophisticated approach to data analysis.
With the ability to analyze vast amounts of data and uncover hidden insights, organizations can make more informed decisions that can help them gain a competitive edge.
However, it’s important to remember that advanced analytics is not a silver bullet. It requires skilled professionals with a deep understanding of data analysis techniques and tools and a commitment to ongoing training and development.
Additionally, it’s crucial to ensure that any analytics initiatives are aligned with the overall goals and strategy of the organization.
By investing in advanced analytics and developing a data-driven culture, businesses can unlock the full potential of their data and make more informed, strategic decisions. With the right tools and expertise, advanced analytics can be a game-changer for organizations in any industry.


